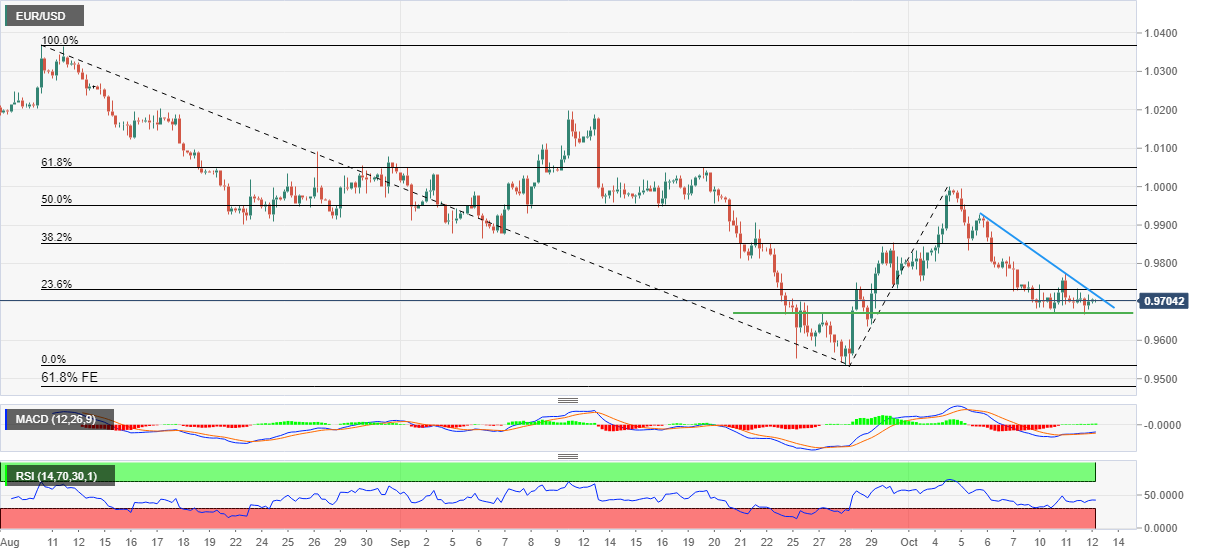
EUR/USD Price Analysis: Stays inside familiar range surrounding 0.9700
- EUR/USD remains sidelined in an immediate 70-pip trading region.
- Sluggish MACD, RSI also back sideways performance between three-week-old horizontal support and descending resistance line from October 06.
- Bears have a comparatively smoother road to return than buyers.
EUR/USD treads water around 0.9700, staying inside a familiar 70-pip trading range during Thursday’s Asian session. In doing so, the major currency pair portrays the typical pre-data trading lull ahead of the US Consumer Price Index (CPI) data for September.
That said, a three-week-old horizontal line restricts the EUR/USD pair’s immediate downside around 0.9670 while a one-week-long descending trend line joins the 23.6% Fibonacci retracement level of the August-September downside, near 0.9740 to challenge buyers.
It’s worth noting that the RSI (14) and the MACD also portray sluggish markets and hence it all depends upon the scheduled US inflation data.
Even so, the EUR/USD bears might have a quick fall towards the yearly low of 0.9537 on breaking 0.9670 support, which appears smoother than the likely hardships for buyers due to multiple hurdles in the north.
If the quote remains weak past 0.9670, the 61.8% Fibonacci Expansion (FE) of the August-October moves, near 0.9480, will be in focus.
Alternatively, an upside clearance of the 0.9740 hurdle will need validation from the recent swing high near 0.9775 to convince buyers.
Following that, the 38.2% Fibonacci retracement level of 0.9853 and the monthly high near the parity could challenge the EUR/USD pair buyers.
EUR/USD: Four-hour chart

Trend: Sideways
