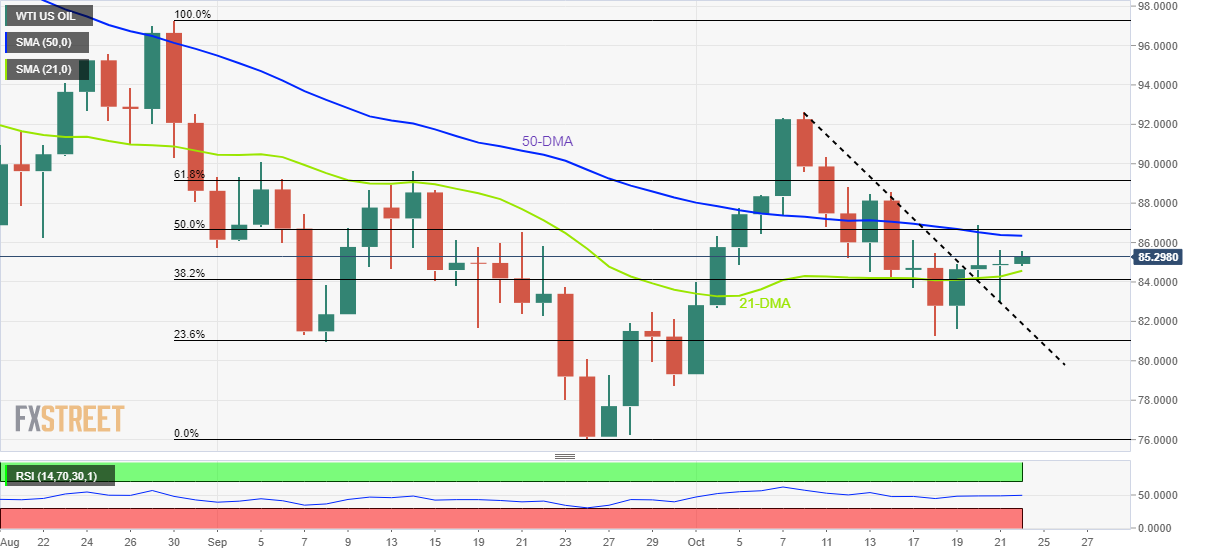
WTI Price Analysis: Justifies Friday’s Dragonfly Doji above $85.00
- WTI picks up bids to renew intraday high, justifies bullish candlestick.
- Sustained bounce off previous resistance line, 21-DMA faovr buyers to aim for 50-DMA.
- Sellers need validation from $81.30 before challenging yearly low.
WTI crude oil prices print 0.70% intraday gains as buyers cheer the previous day’s bullish candlestick formation around $85.50 during Monday’s Asian session.
In doing so, the black gold also keeps Friday’s rebound from the resistance-turned-support line stretched from October 10.
Given the steady RSI (14) and the bullish signals from the latest candlestick, as well as the rebound from the previous resistance line, WTI buyers are likely approaching the 50-DMA hurdle surrounding $86.35.
Also acting as an upside filter is the 50% Fibonacci retracement level of August-September moves, near $86.65 and the 61.8% Fibonacci retracement level of $89.15.
Should the quote rises past $89.15, the monthly high near $92.65 will be on the buyer’s radar.
Meanwhile, the 21-DMA and the previous resistance line, respectively around $84.55 and $81.90, restrict the short-term downside of the black gold.
In a case where WTI bears keep the reins past $81.90, the odds of witnessing a slump toward September’s low of $76.15 can’t be ruled out.
WTI: Daily chart
Trend: Further recovery expected

