Natural Gas Price Analysis: XNG/USD rebound remains unimpressive below $2.45
- Natural Gas price grinds higher after reversing from two-week low, prints the first daily gains in three.
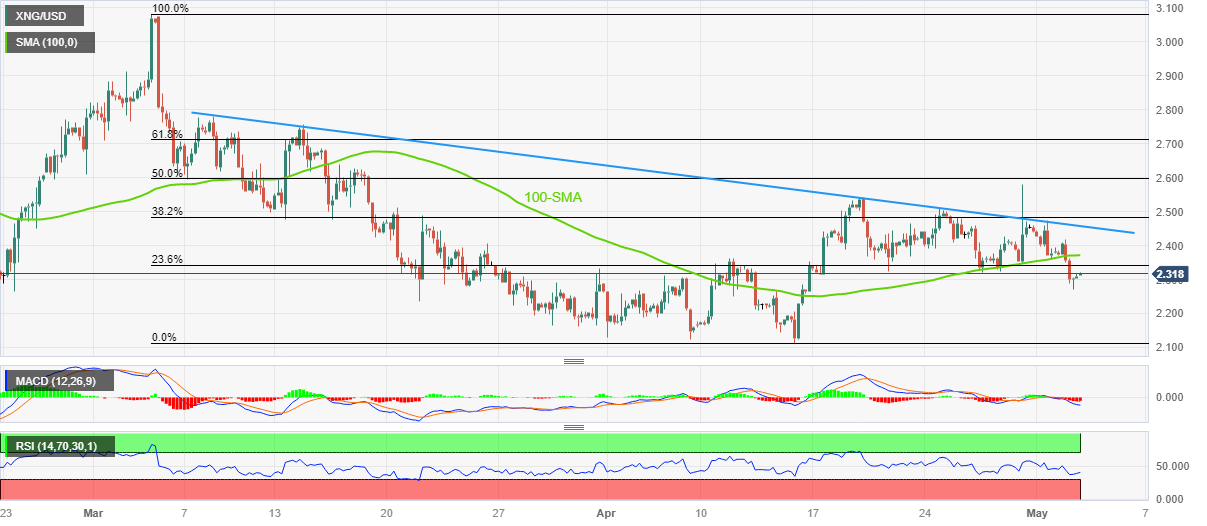
- Clear downside break of 100-SMA, bearish MACD signals favor XNG/USD sellers.
- Two-month-old descending trend line appears crucial hurdle for Natural Gas buyers to tackle.
Natural Gas (XNG/USD) price seesaws around the intraday high of $2.32 as bulls await fresh clues to extend the previous day’s rebound from a 12-day low. In doing so, the energy instrument traces the broad market anxiety ahead of the key Federal Open Market Committee (FOMC) monetary policy meeting announcements early Wednesday.
It’s worth noting that the XNG/USD’s latest rebound snaps a two-day losing streak as RSI (14) line recovers towards the 50.0 level, suggesting further short-covering.
However, the bearish MACD signals and the 100-SMA hurdle of $2.37 can challenge the immediate upside of the Natural Gas price.
Even if the XNG/USD manages to cross the $2.37 SMA hurdle, a downward-sloping resistance line from early March, close to $2.45 by the press time, appears the key challenge for the buyers to tackle before retaking the control.
Meanwhile, the $2.30 round figure and the latest low surrounding $2.27 restrict the immediate downside of the Natural Gas price.
Following that, multiple levels near $2.20 can check the XNG/USD bears before directing them to the Year-To-Date (YTD) low marked in April around $2.11.
Should the Natural Gas bears manage to keep the reins past $2.11, the odds of witnessing a slump toward the $2.00 round figure can’t be ruled out.
Natural Gas Price: Four-hour chart
Trend: Limited recovery expected