Back
5 Jun 2023
WTI Price Analysis: Bulls are waiting in the flanks of the Fibonacci scale
- The oil price is on the backside of the trend and this leaves the outlook meanwhile bullish.
- WTI bulls are lurking within the Fibonacci scale.
Crude prices jumped today after Saudi Arabia said it would cut its crude production by -1.0 million bpd starting in July. However, weaker-than-expected global economic news raised concerns about energy demand, and crude prices fell back from their best levels. WTI is trading back to $74.50 and within the day´s range of between $74.92 and $72.07 the low. The following illustrates the technical outlook at this juncture:
WTI daily chart
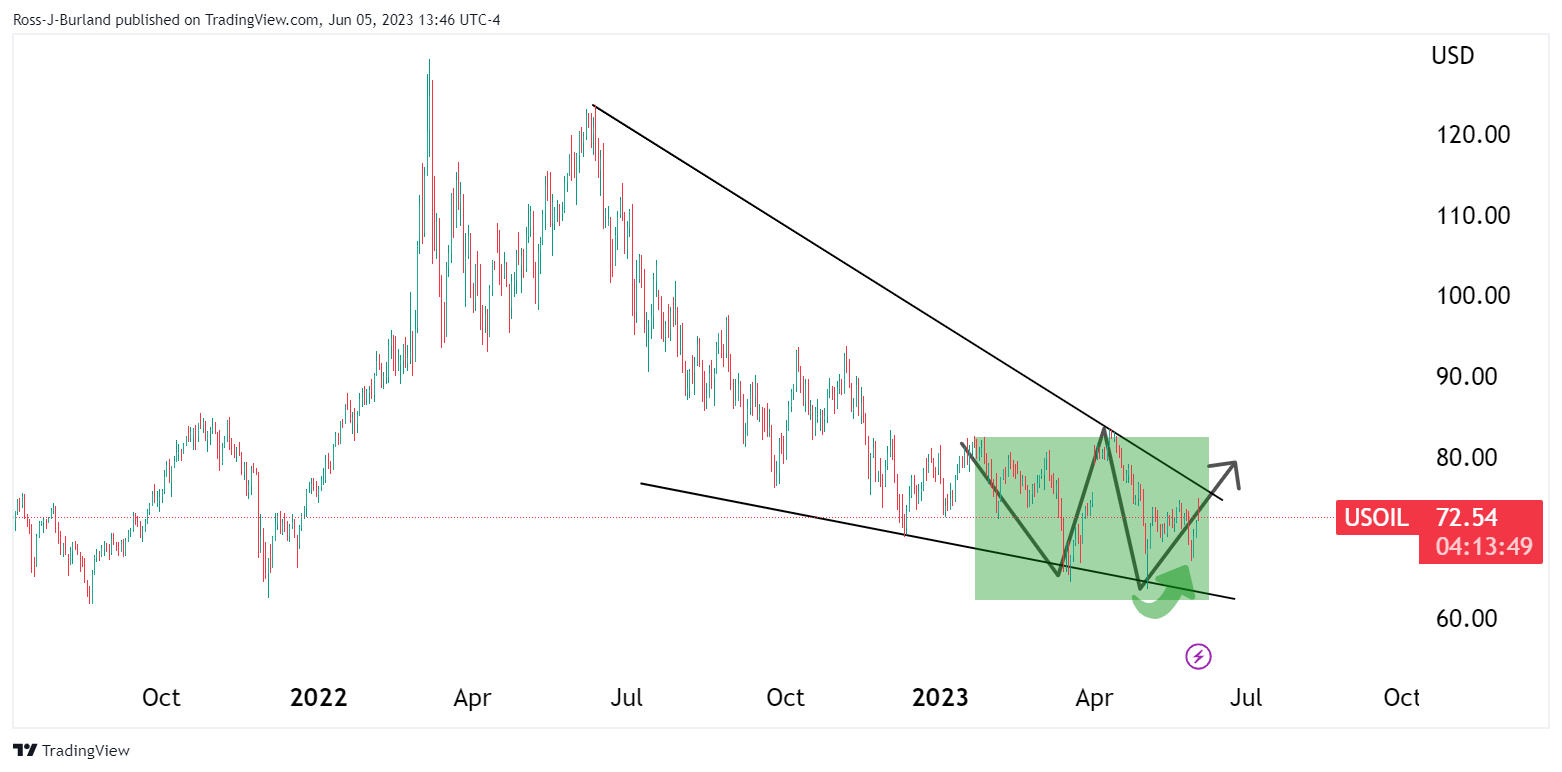
The double bottom is a bullish feature on the longer-term charts with the price coiled within a falling bullish wedge formation.
WTI H1 chart
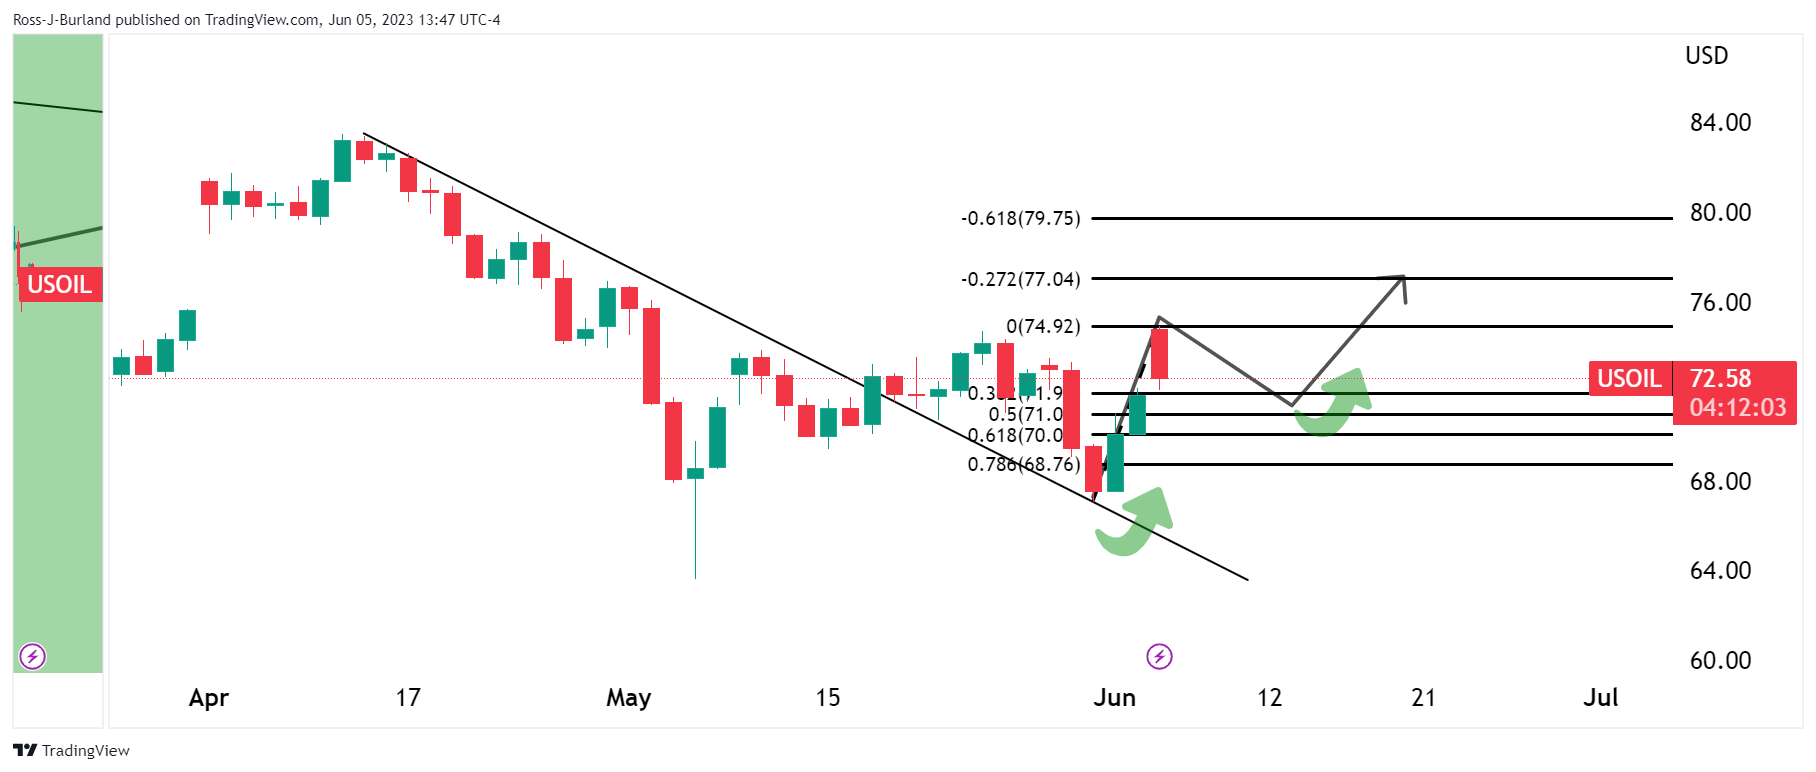
The price has pulled back into the gap but remains on the backside of the prior bearish trendline. This leaves scope for a move up from within the Fibonacci scale in due course.