GBP/USD Technical Analysis: Bidders spinning their wheels at 1.2750 amidst descending triangle
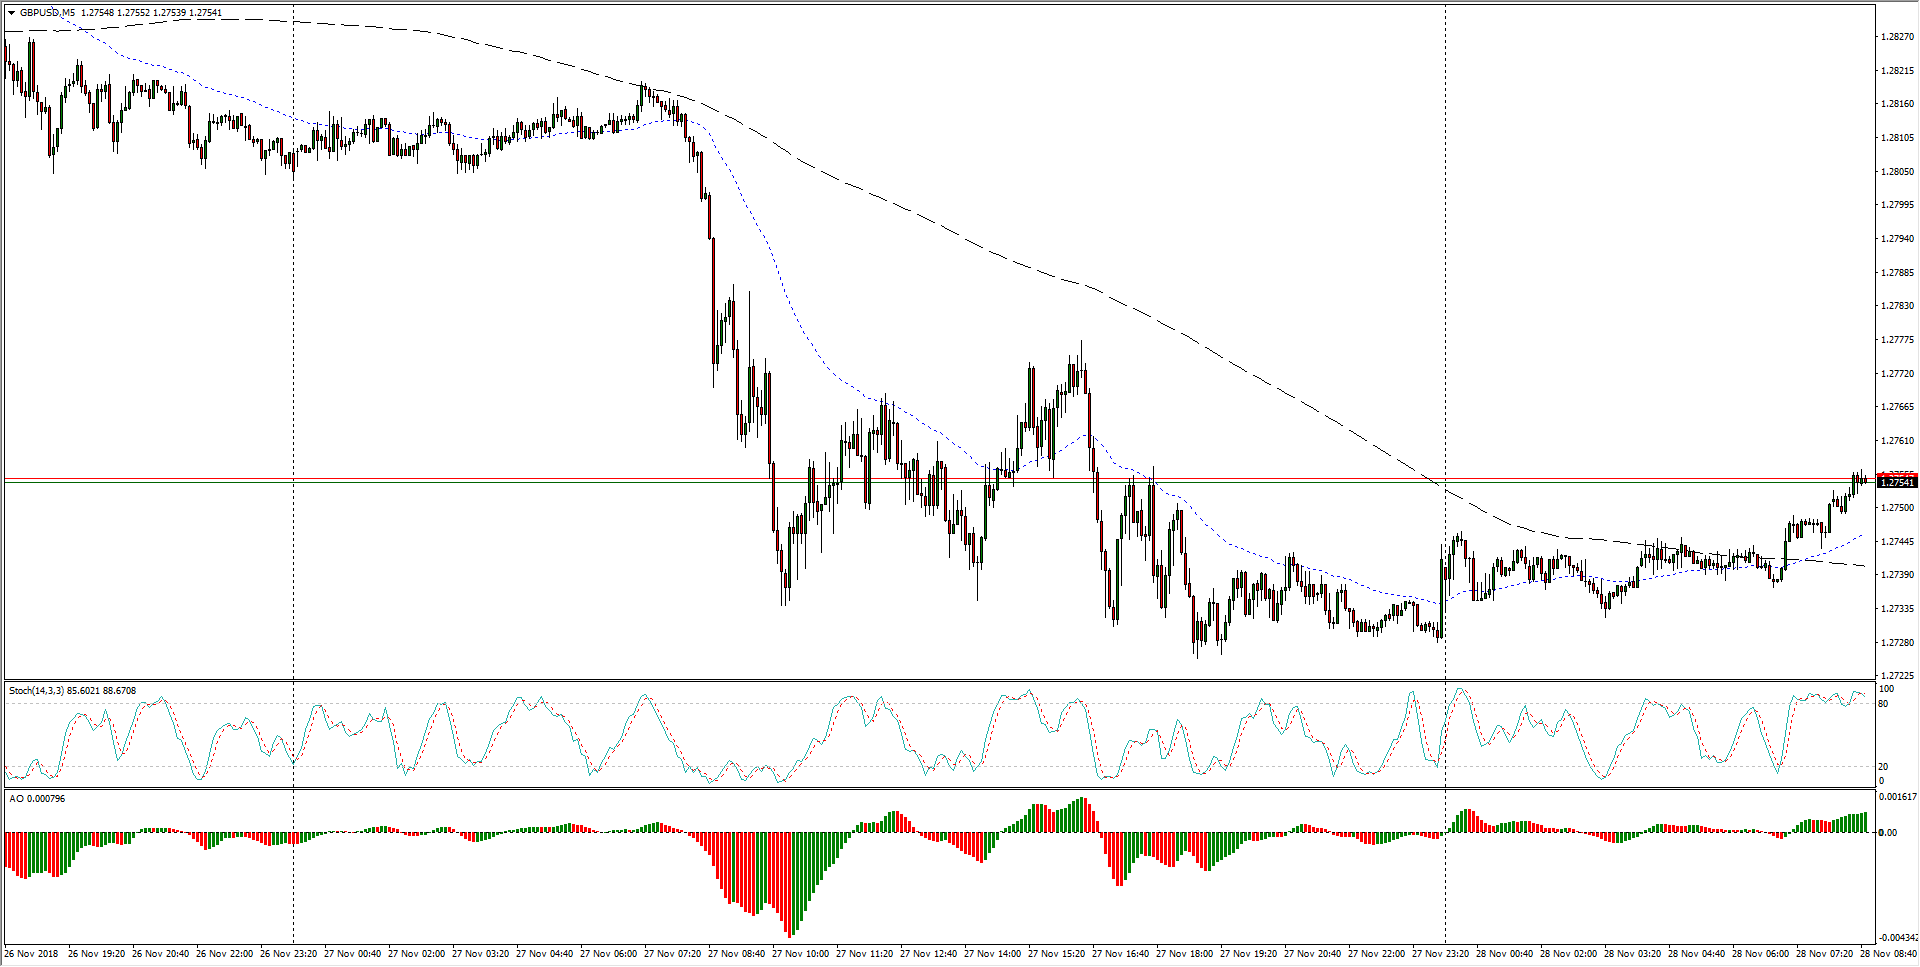
- The GBP/USD pairing is catching some bids in the pre-London session, rising over 1.2750 in early Wednesday trading, but the pair remains steeply off of recent highs, losing the 1.2800 major handle in Tuesday's trading as the Cable market remains fairly risk-off.
- An intraday floor has been priced in near 1.2725 as the Cable lifts above the 200-period moving average near 1,2740.
GBP/USD, 5-Minute

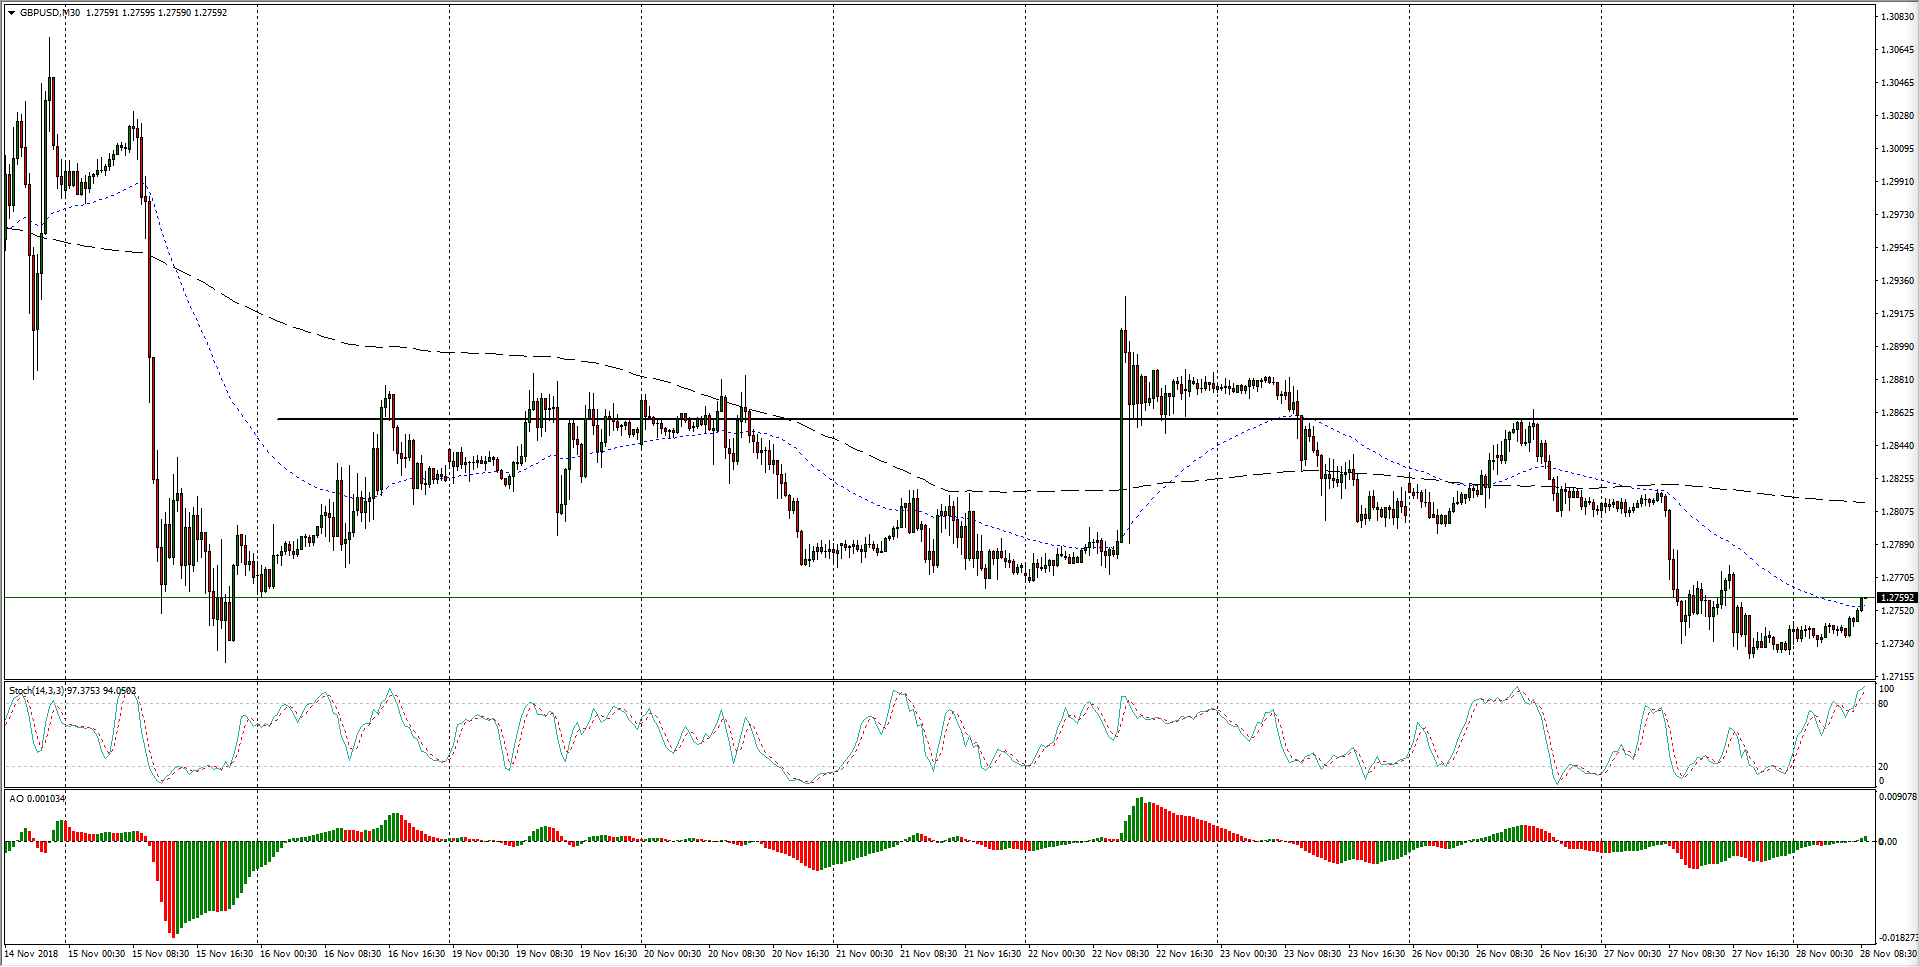
- Going back over the past two weeks, 1.2860 remains a key inflection point, and near-term bulls will be waiting for a successful break-and-retest of the congestion region before stepping up their long orders.
GBP/USD, 30-Minute

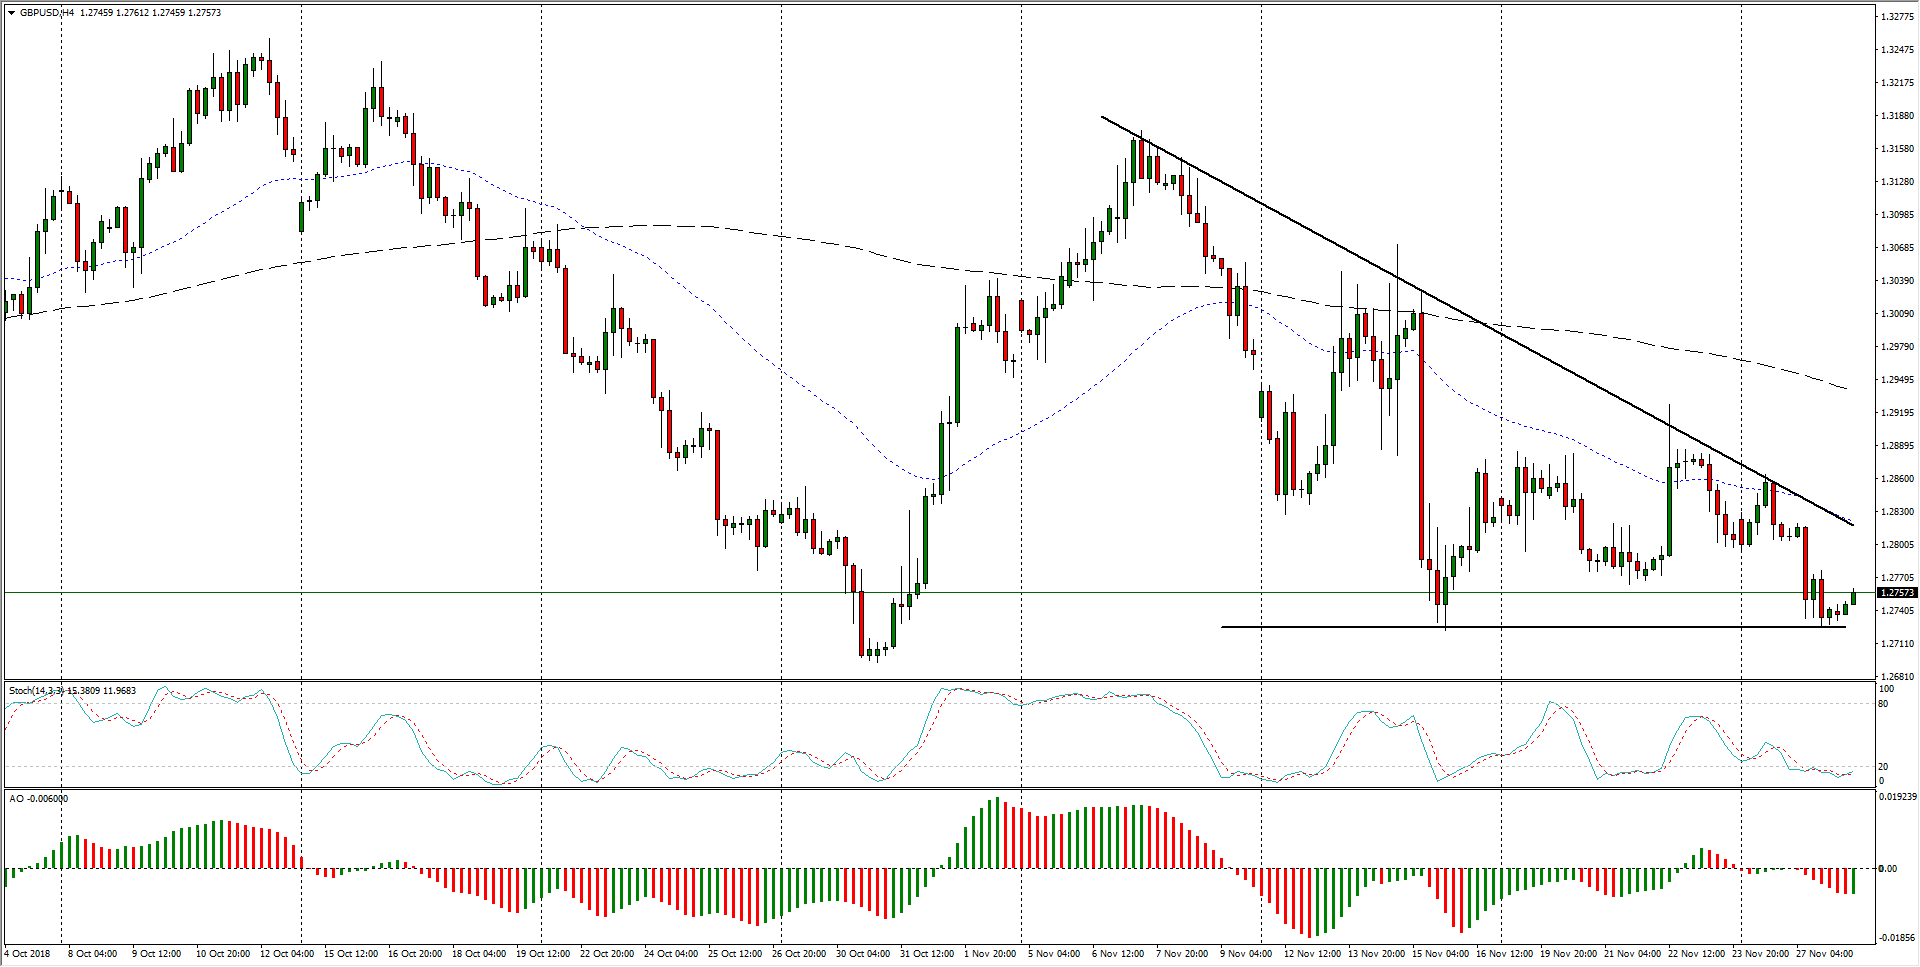
- In the medium-term, the Cable is confined neatly in a descending triangle, while a fresh break into the 1.2700 level will see further downside open up as bearish bets break free of a heavy stop zone.
GBP/USD, 4-Hour

GBP/USD
Overview:
Today Last Price: 1.2755
Today Daily change: 21 pips
Today Daily change %: 0.165%
Today Daily Open: 1.2734
Trends:
Previous Daily SMA20: 1.2906
Previous Daily SMA50: 1.2992
Previous Daily SMA100: 1.299
Previous Daily SMA200: 1.3335
Levels:
Previous Daily High: 1.2836
Previous Daily Low: 1.2725
Previous Weekly High: 1.2928
Previous Weekly Low: 1.2764
Previous Monthly High: 1.326
Previous Monthly Low: 1.2696
Previous Daily Fibonacci 38.2%: 1.2767
Previous Daily Fibonacci 61.8%: 1.2793
Previous Daily Pivot Point S1: 1.2694
Previous Daily Pivot Point S2: 1.2654
Previous Daily Pivot Point S3: 1.2584
Previous Daily Pivot Point R1: 1.2805
Previous Daily Pivot Point R2: 1.2875
Previous Daily Pivot Point R3: 1.2915
