GBP/USD Technical Analysis: Cable trading near 1.3030 ahead of FOMC Minutes
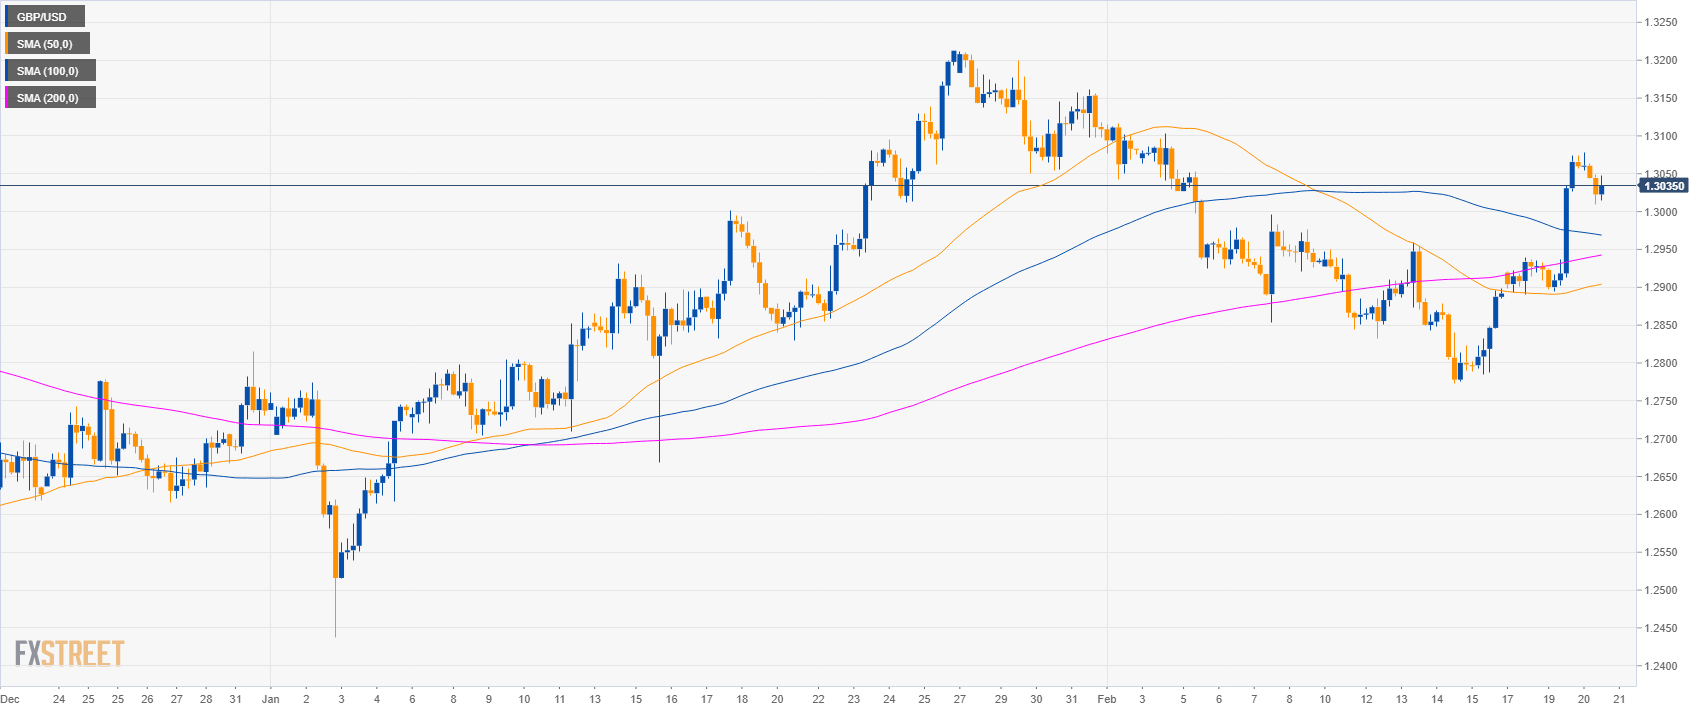
GBP/USD daily chart
- GBP/USD bulls have reclaimed the 200-day simple moving average (SMA).
- Investors are awaiting the release of the FOMC Minutes at 19.00 GMT. The news can potentially provide high volatility in the financial markets and in USD-related pairs.

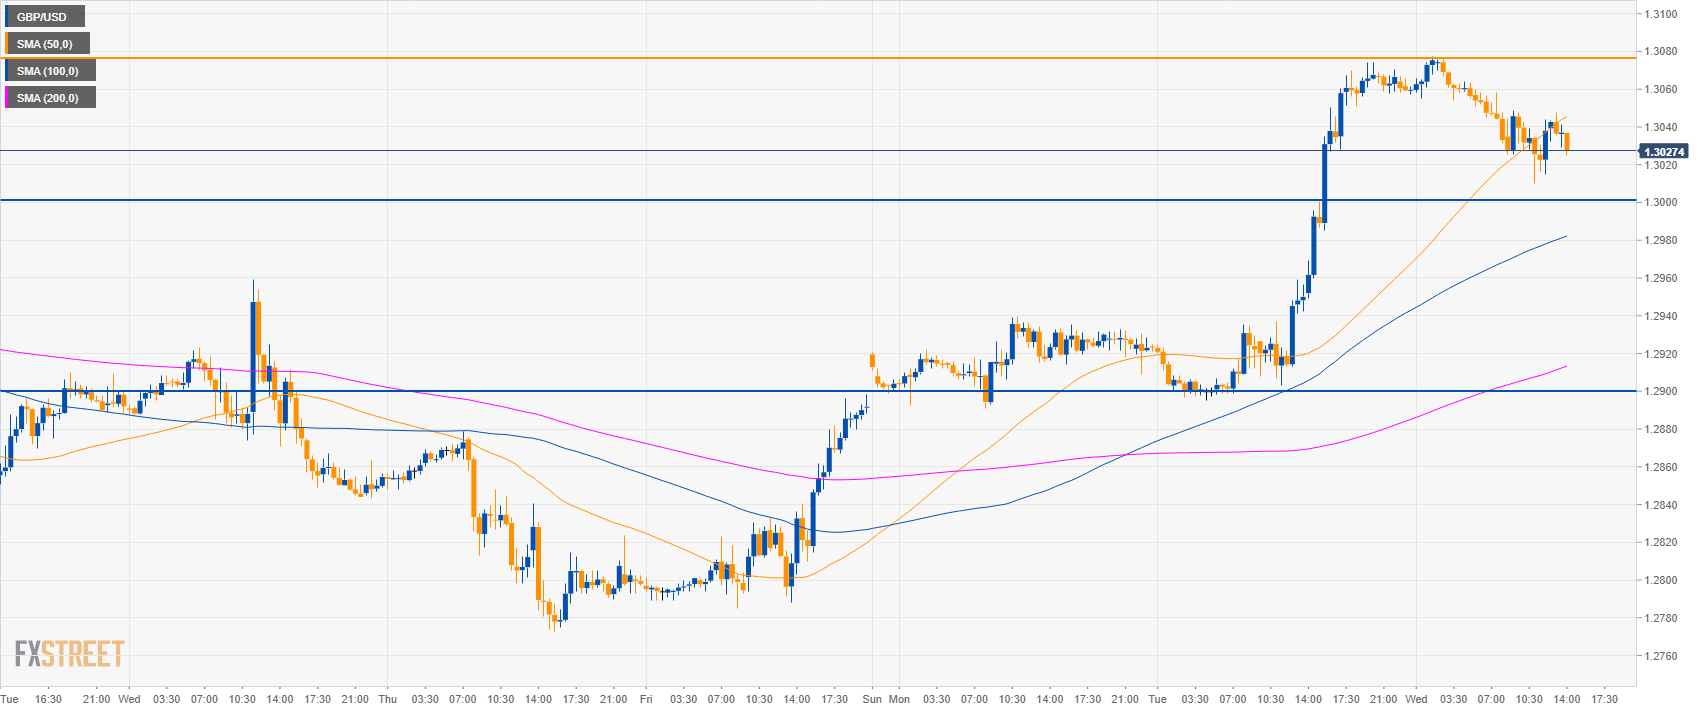
GBP/USD 4-hour chart
- GBP/USD bulls broke above the main SMAs suggesting a bullish bias in the medium-term.
GBP/USD 30-minute chart
- GBP/USD is trading above the main SMAs suggesting a bullish momentum in the short-term.
- The level to beat for bulls is 1.3080. The next target to the upside is seen at 1.3125 and 1.3185 level.
- Support is at 1.3000 and 1.2960 level.
Additional key levels
GBP/USD
Overview:
Today Last Price: 1.3034
Today Daily change: -33 pips
Today Daily change %: -0.25%
Today Daily Open: 1.3067
Trends:
Daily SMA20: 1.2999
Daily SMA50: 1.2843
Daily SMA100: 1.2878
Daily SMA200: 1.3002
Levels:
Previous Daily High: 1.3074
Previous Daily Low: 1.2895
Previous Weekly High: 1.2959
Previous Weekly Low: 1.2773
Previous Monthly High: 1.3214
Previous Monthly Low: 1.2438
Daily Fibonacci 38.2%: 1.3006
Daily Fibonacci 61.8%: 1.2963
Daily Pivot Point S1: 1.295
Daily Pivot Point S2: 1.2833
Daily Pivot Point S3: 1.2771
Daily Pivot Point R1: 1.3129
Daily Pivot Point R2: 1.3191
Daily Pivot Point R3: 1.3308