AUD/JPY technical analysis: Buyers respect 4H 200MA, aim for 12-day long resistance-line
- Repeated bounces off 4H 200MA, gradually rising RSI favor the AUD/JPY pair’s further upside towards short-term resistance-line.
- A break of key MA can quickly flash 61.8% Fibonacci retracement on the chart.
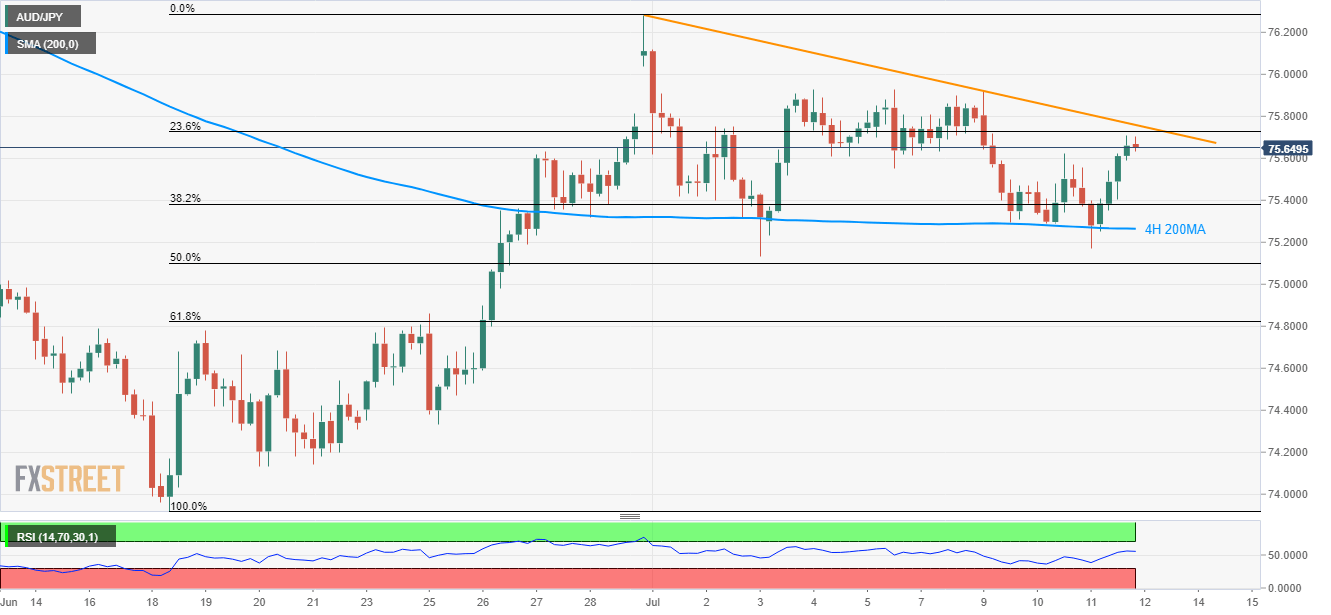
With its sustained trading beyond 200-bar moving average on the 4-hour chart (4H 200MA), backed by momentum indicator, the AUD/JPY pair takes the rounds to 75.66 during the early Asian session on Friday.
A 12-day long descending trend-line at 75.76 acts as an immediate resistance to the pair ahead of highlighting 75.91/93 area comprising multiple tops since early-month.
In a case prices rally past-75.93, 76.00 and June-end high near 76.30 can please the bulls.
Meanwhile, a downside break of 4H 200MA level of 75.26 can quickly drag prices to 61.8% Fibonacci retracement of late-June advances, at 74.82.
Should there be additional declines beneath 74.82, June 20 bottoms surrounding 74.15 can gain sellers’ attention.
Further to note, 14-bar relative strength index (RSI), a momentum indicator, runs positive and away from the overbought region to favor further upside of the pair.
AUD/JPY 4-hour chart
Trend: Bullish