GBP/USD technical analysis: 1.2570, 50% Fibo. remain on bull’s radar
- The sustained trading beyond 23.6% Fibonacci retracement, 100-HMA favors the GBP/USD pair’s on-going recovery.
- A horizontal-line comprising early-month low, current-week high acts immediate key resistance.
Despite failing to grow past-early month lows, GBP/USD remains on the road to recovery as it takes the rounds to 1.2550 ahead of the UK open on Friday.
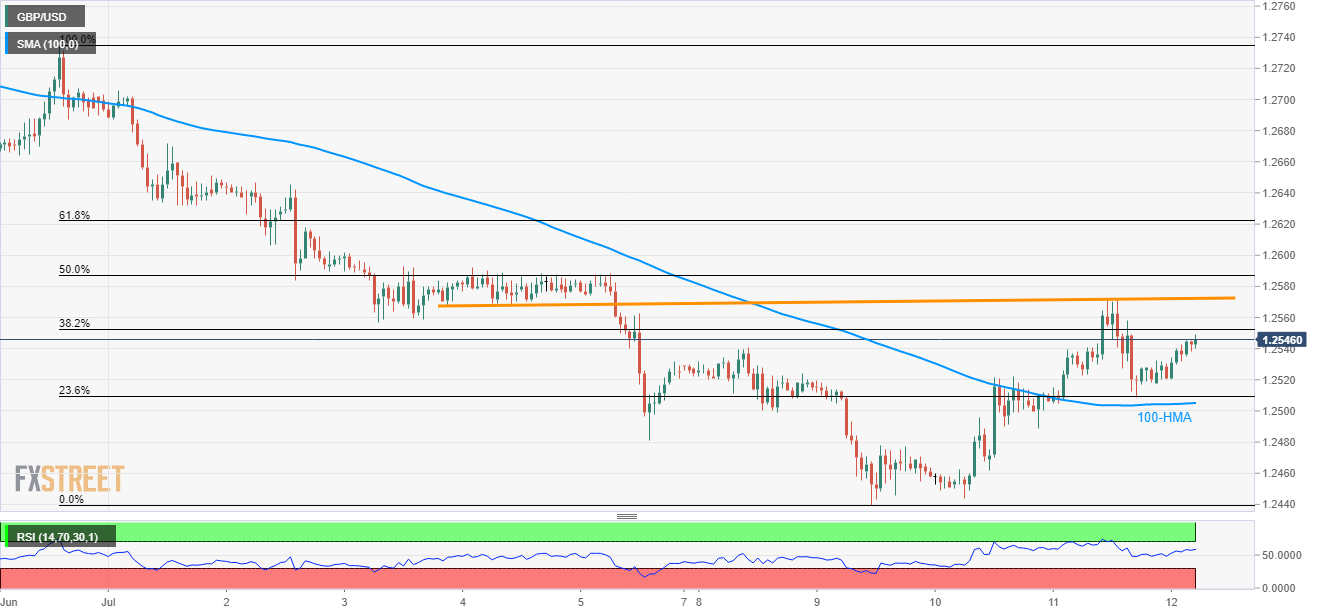
While gradual recovery of the 14-bar relative strength index (RSI) signals the pair’s upside, the horizontal area around 1.2570, comprising early-month low and current-week high, acts as key immediate resistance for the pair.
On the beak of 1.2570, 50% Fibonacci retracement of the latest downpour ending on July 09 at 1.2587 can please the buyers whereas 1.2600 and 1.2630 could be next on their radars.
Alternatively, 23.6% Fibonacci retracement and 100-hour moving average (HMA) close to 1.2505/10 can limit near-term declines of the pair.
Should there be additional weakness past-1.2505, current month low surrounding 1.2440 and the year 2019 bottom around 1.2430 seem crucial to watch.
GBP/USD hourly chart
Trend: Bullish