Back
11 Oct 2019
GBP/USD technical analysis: Cable clings to multi-month highs near 1.2700 into the London close
- EU27 tunnel negotiations with the United Kingdom triggered another leg up.
- GBP/USD is keeping the bullish pressure on into the London close.
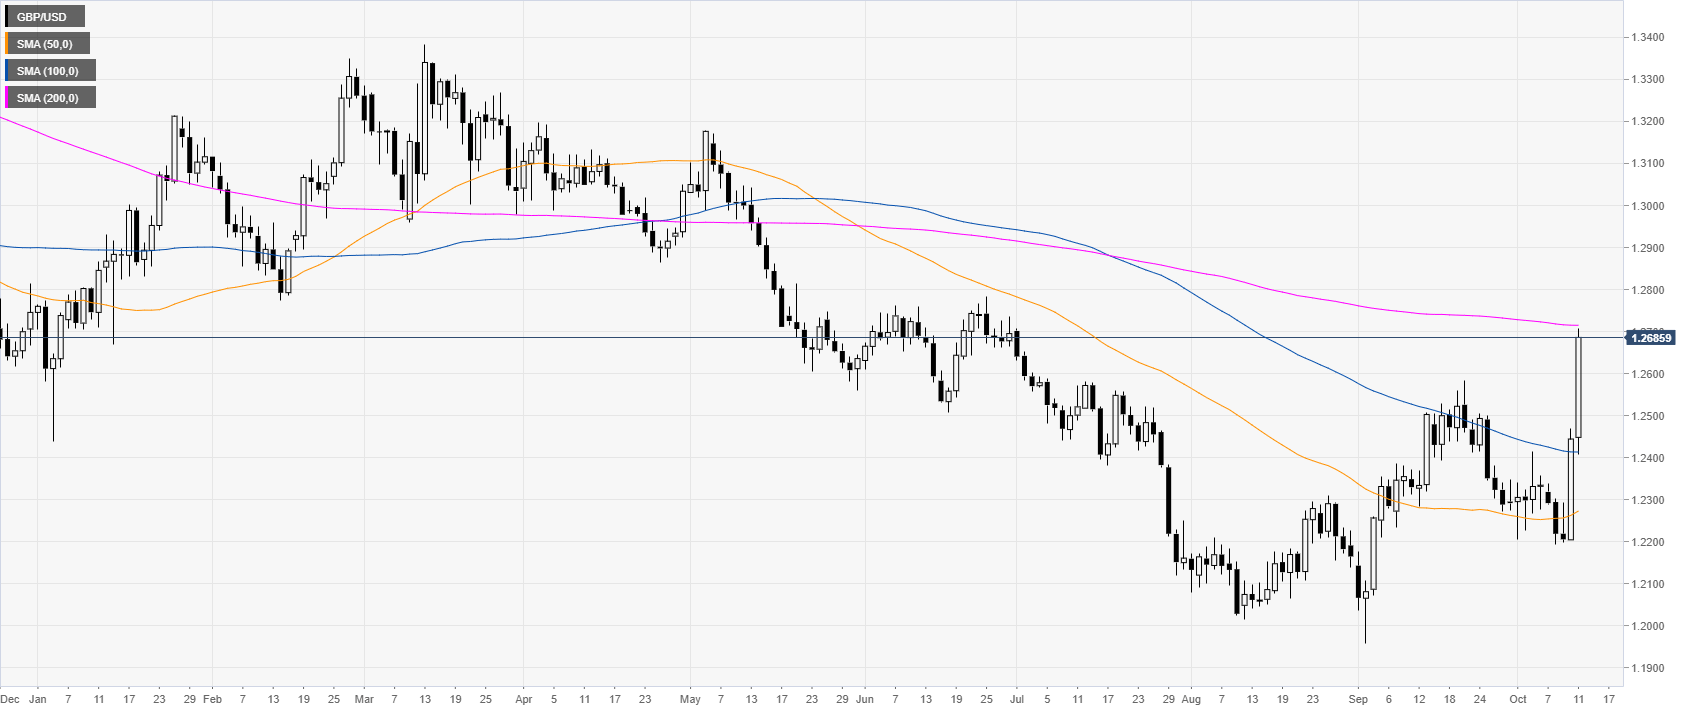
GBP/USD daily chart
The Cable, on the daily chart, is trading in a bear trend below its 200-day simple moving average (DSMA). However, GBP/USD is up about 500 pips from the October lows as the Cable is on track to its biggest two-day rally since 2016. The last leg up was triggered as EU’s Chief Brexit Negotiator Barnier gave the green light from the EU27 for a tunnel negotiation with the United Kingdom.
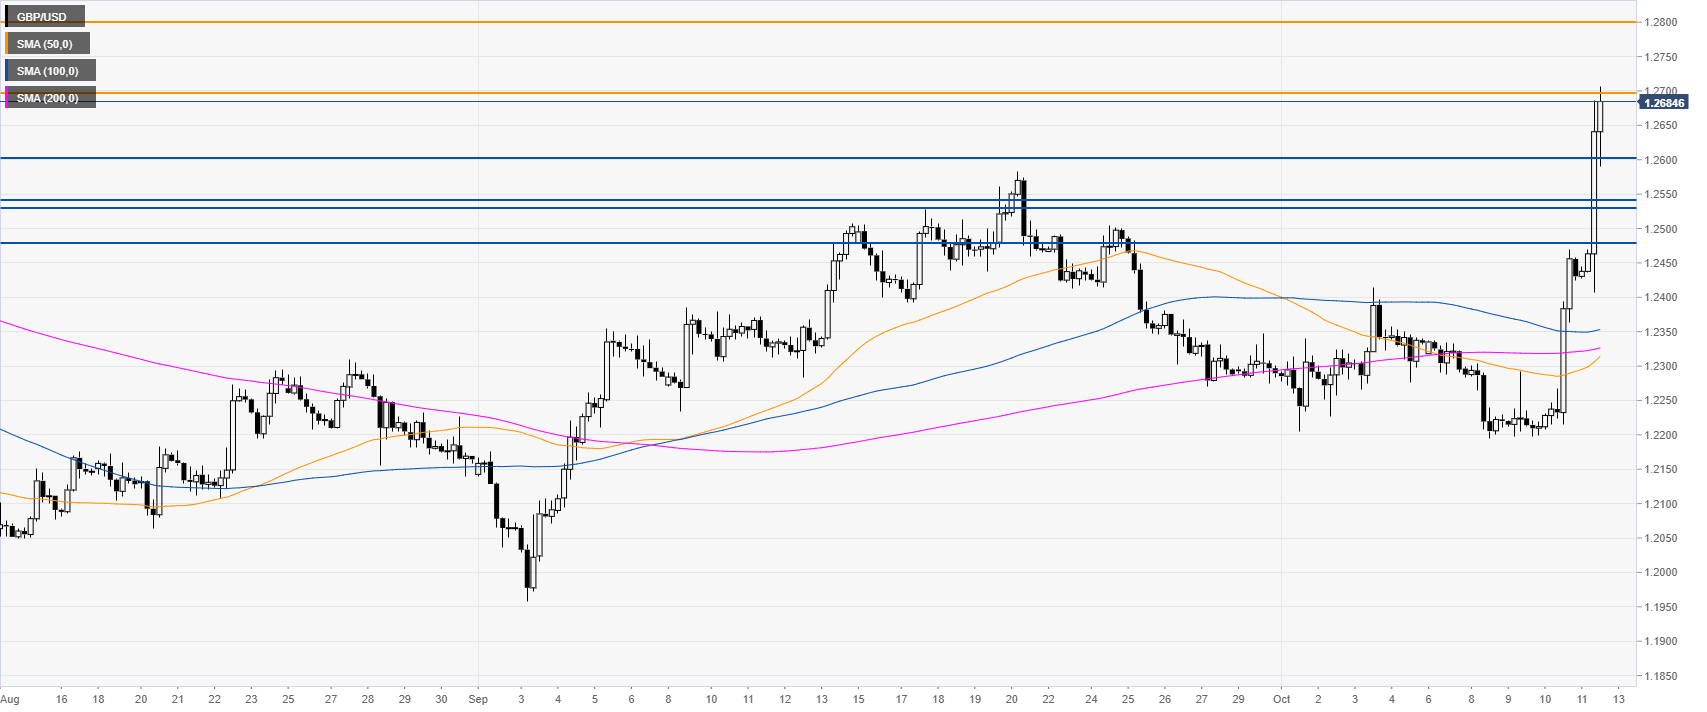
GBP/USD four-hour chart
GBP/USD is challenging the 1.2700 handle into the London close. If the market breaks above this level the next resistance of interest can be the 1.2800 handle.
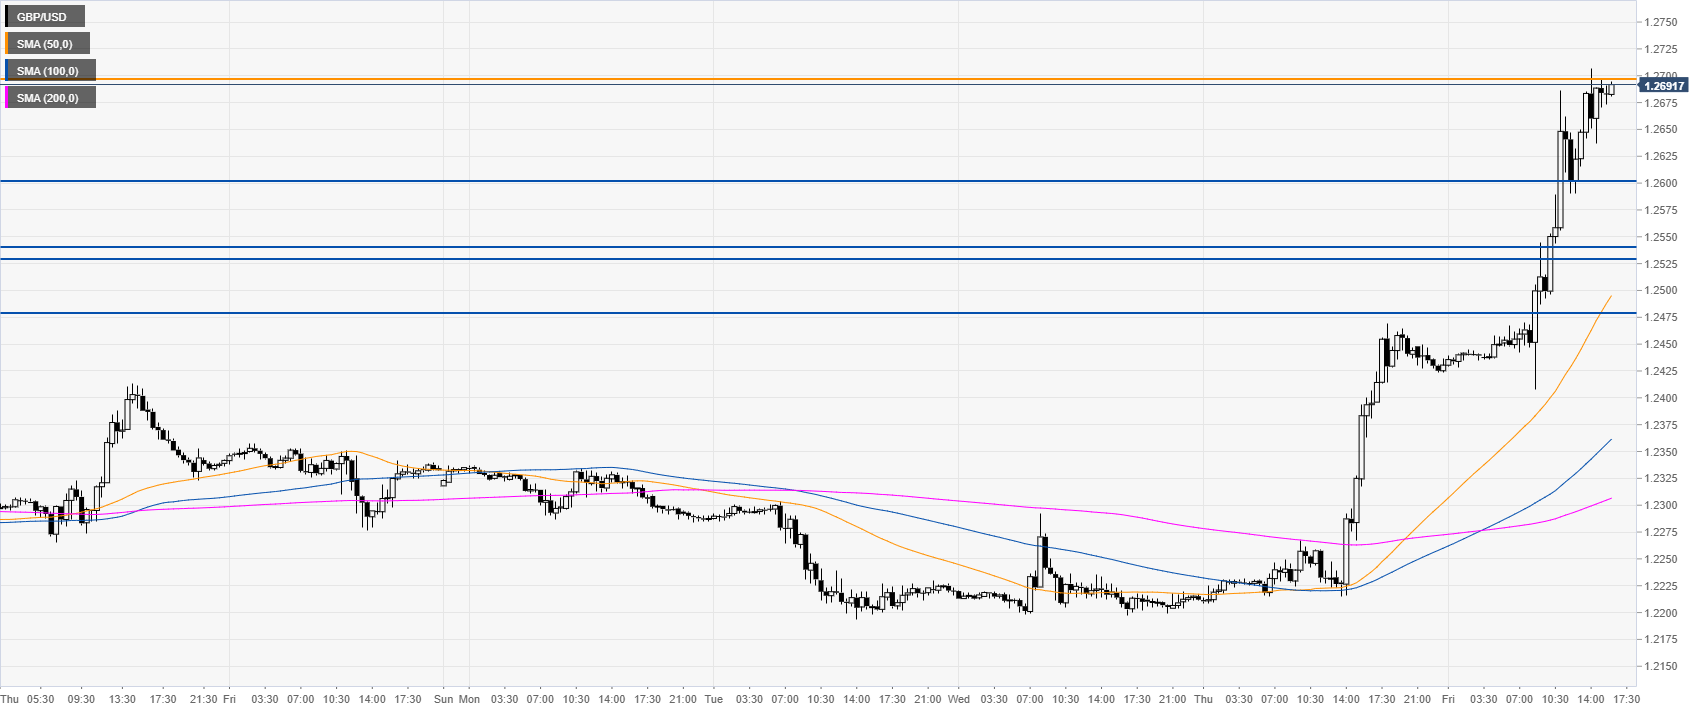
GBP/USD 30-minute chart
The Sterling is trading above its main SMAs, suggesting bullish momentum in the near term. Support is seen at the 1.2600, 1.2543/30 zone and the 1.2477 level, according to the Technical Confluences Indicator.
Additional key levels