Back
30 Oct 2019
USD/IDR technical analysis: Looks sidelined inside the triangle below 200-bar SMA
- USD/IDR remains inside the one-week-old symmetrical triangle.
- Prices stay below key short-term Simple Moving Average (SMA), indicating weakness in momentum.
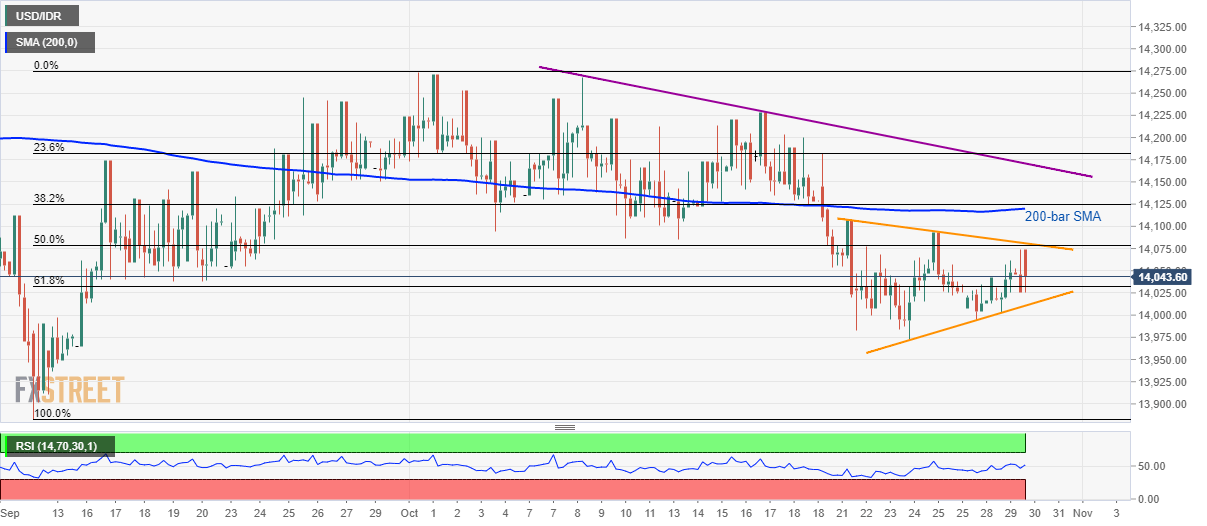
USD/IDR keeps following an immediate trading range while taking rounds to 14,043 during early Wednesday.
The pair needs to break a one-week-old symmetrical triangle, currently between 14,010 and 14,090, to register further momentum.
Adding to the upside barriers is the 50% Fibonacci retracement of September-October upside, at 14,080, 200-day SMA level of 14,120 and a downward sloping trend-line since October 08, at 14,170.
Meanwhile, the pair’s downside break of 14,010 may take rest around 13,980 before revisiting September month's bottom close to 13,880.
USD/IDR 4-hour chart

Trend: sideways
