Back
7 Feb 2020
USD/INR Price Analysis: Greenback challenges the 71.60 resistance vs. rupee
- USD/INR had a bear flag initial breakdown and a retest of the 71.60 resistance.
- Support is seen at the 71.20 and if broken 70.40 can become next on the bears’radar.
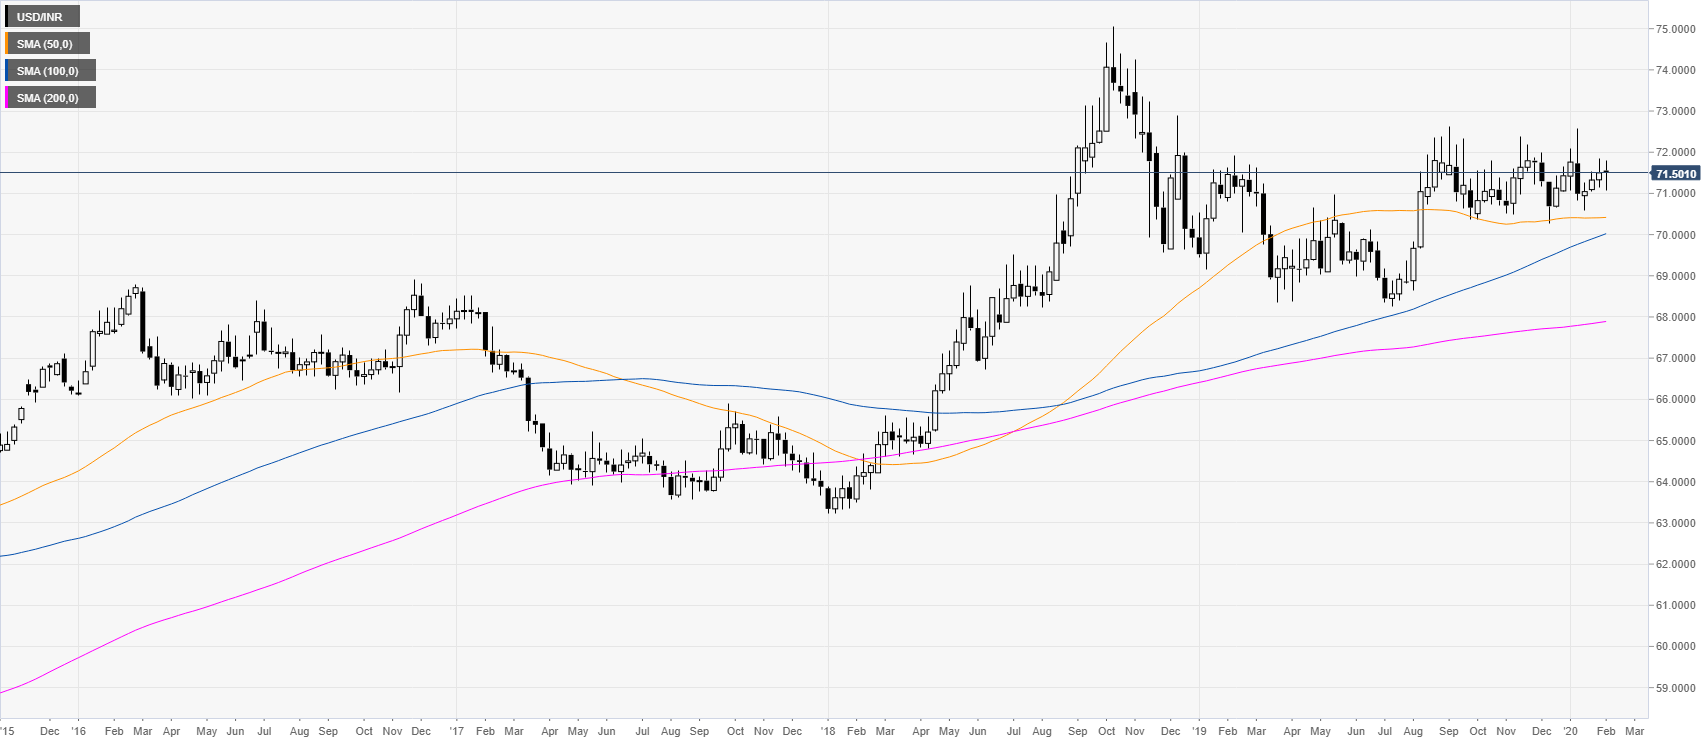
USD/INR weekly chart
After the 2018 bull-market, USD/INR has been consolidating in a rectangle formation. The spot is evolving above its main weekly simple moving averages (SMAs), suggesting a bullish momentum in the long term.
USD/INR daily chart
USD/INR broke below a bear flag pattern near the 71.20 support level and then retested the 71.60 resistance. The spot is still potentially weak below the 72.00 figure and could decline towards the 70.40 price level. However, a daily close above the 72.00 figure can invalidate the bear flag and lead to further upside towards the 72.40 level.
Additional key levels