AUD/JPY Price Analysis: Probes two-week-old resistance trendline
- AUD/JPY snaps three-day winning streak.
- Bullish MACD favors further recoveries towards 100-bar SMA, 50% Fibonacci retracement.
- A sustained break below 23.6% Fibonacci will renew selling pressure.
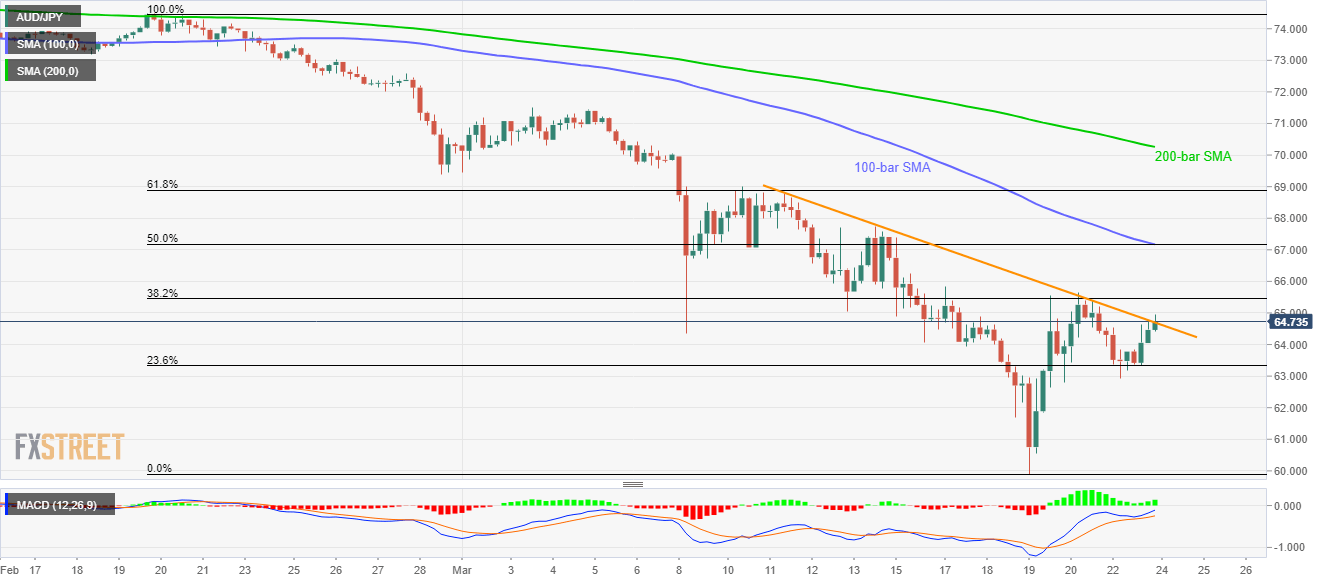
AUD/JPY confronts a short-term trend line resistance while taking rounds to 64.70/75 during the early Asian session on Tuesday. In doing so, the pair remains above 23.6% Fibonacci retracement of its one month fall from February 19.
Should the quote manage to offer a successful break above 64.75 trend line resistance, a confluence of 50% Fibonacci retracement and 100-bar SMA around 67.20 will be the key for buyers.
In a case where the bulls manage to conquer 67.20, 61.8% Fibonacci retracement and 200-bar SMA, respectively around 68.90 and 70.25, will gain the market’s attention.
On the downside, the pair’s declines below 23.6% Fibonacci retracement level of 63.30 could renew selling towards the sub-63.00 area.
Also, 62.50 and 60.00 could lure the sellers during the pair’s extended downside below 63.00.
AUD/JPY four-hour chart
Trend: Further recovery expected