Gold Price Analysis: XAU/USD looks north after Doji at 50-day SMA
- Gold created a Doji on Tuesday, a sign of downtrend fatigue.
- A bounce could be in the offing on Wednesday with markets trading risk-averse.
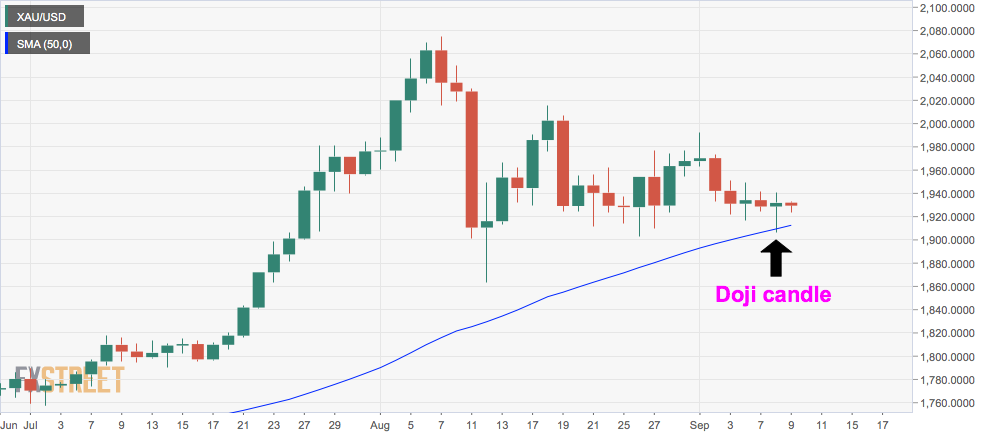
Having defended the widely-tracked 50-day simple moving average (SMA) on Tuesday with a Doji candle, gold now looks set for an upward move.
While the Doji candle is usually considered a sign of indecision in the marketplace, it has appeared at key average support and following a notable pullback from the record high of $2,075 to $1,900.
As such, the Doji is indicative of seller exhaustion. Add to that the risk-off time in the global equities, and the path of least resistance for the yellow metal appears to be on the higher side.
The metal could gather upside traction during the day ahead and test $1,950 – the high of the Sept. 4 Doji candle – in the short-term.
The bias, however, would turn bearish if prices close below Tuesday's low of $1,906. That would expose the support located at 41,863 (Aug. 12 low).
Daily chart
Trend: Bullish