Back
14 Oct 2020
EUR/USD Price Analysis: Daily chart now leans bearish
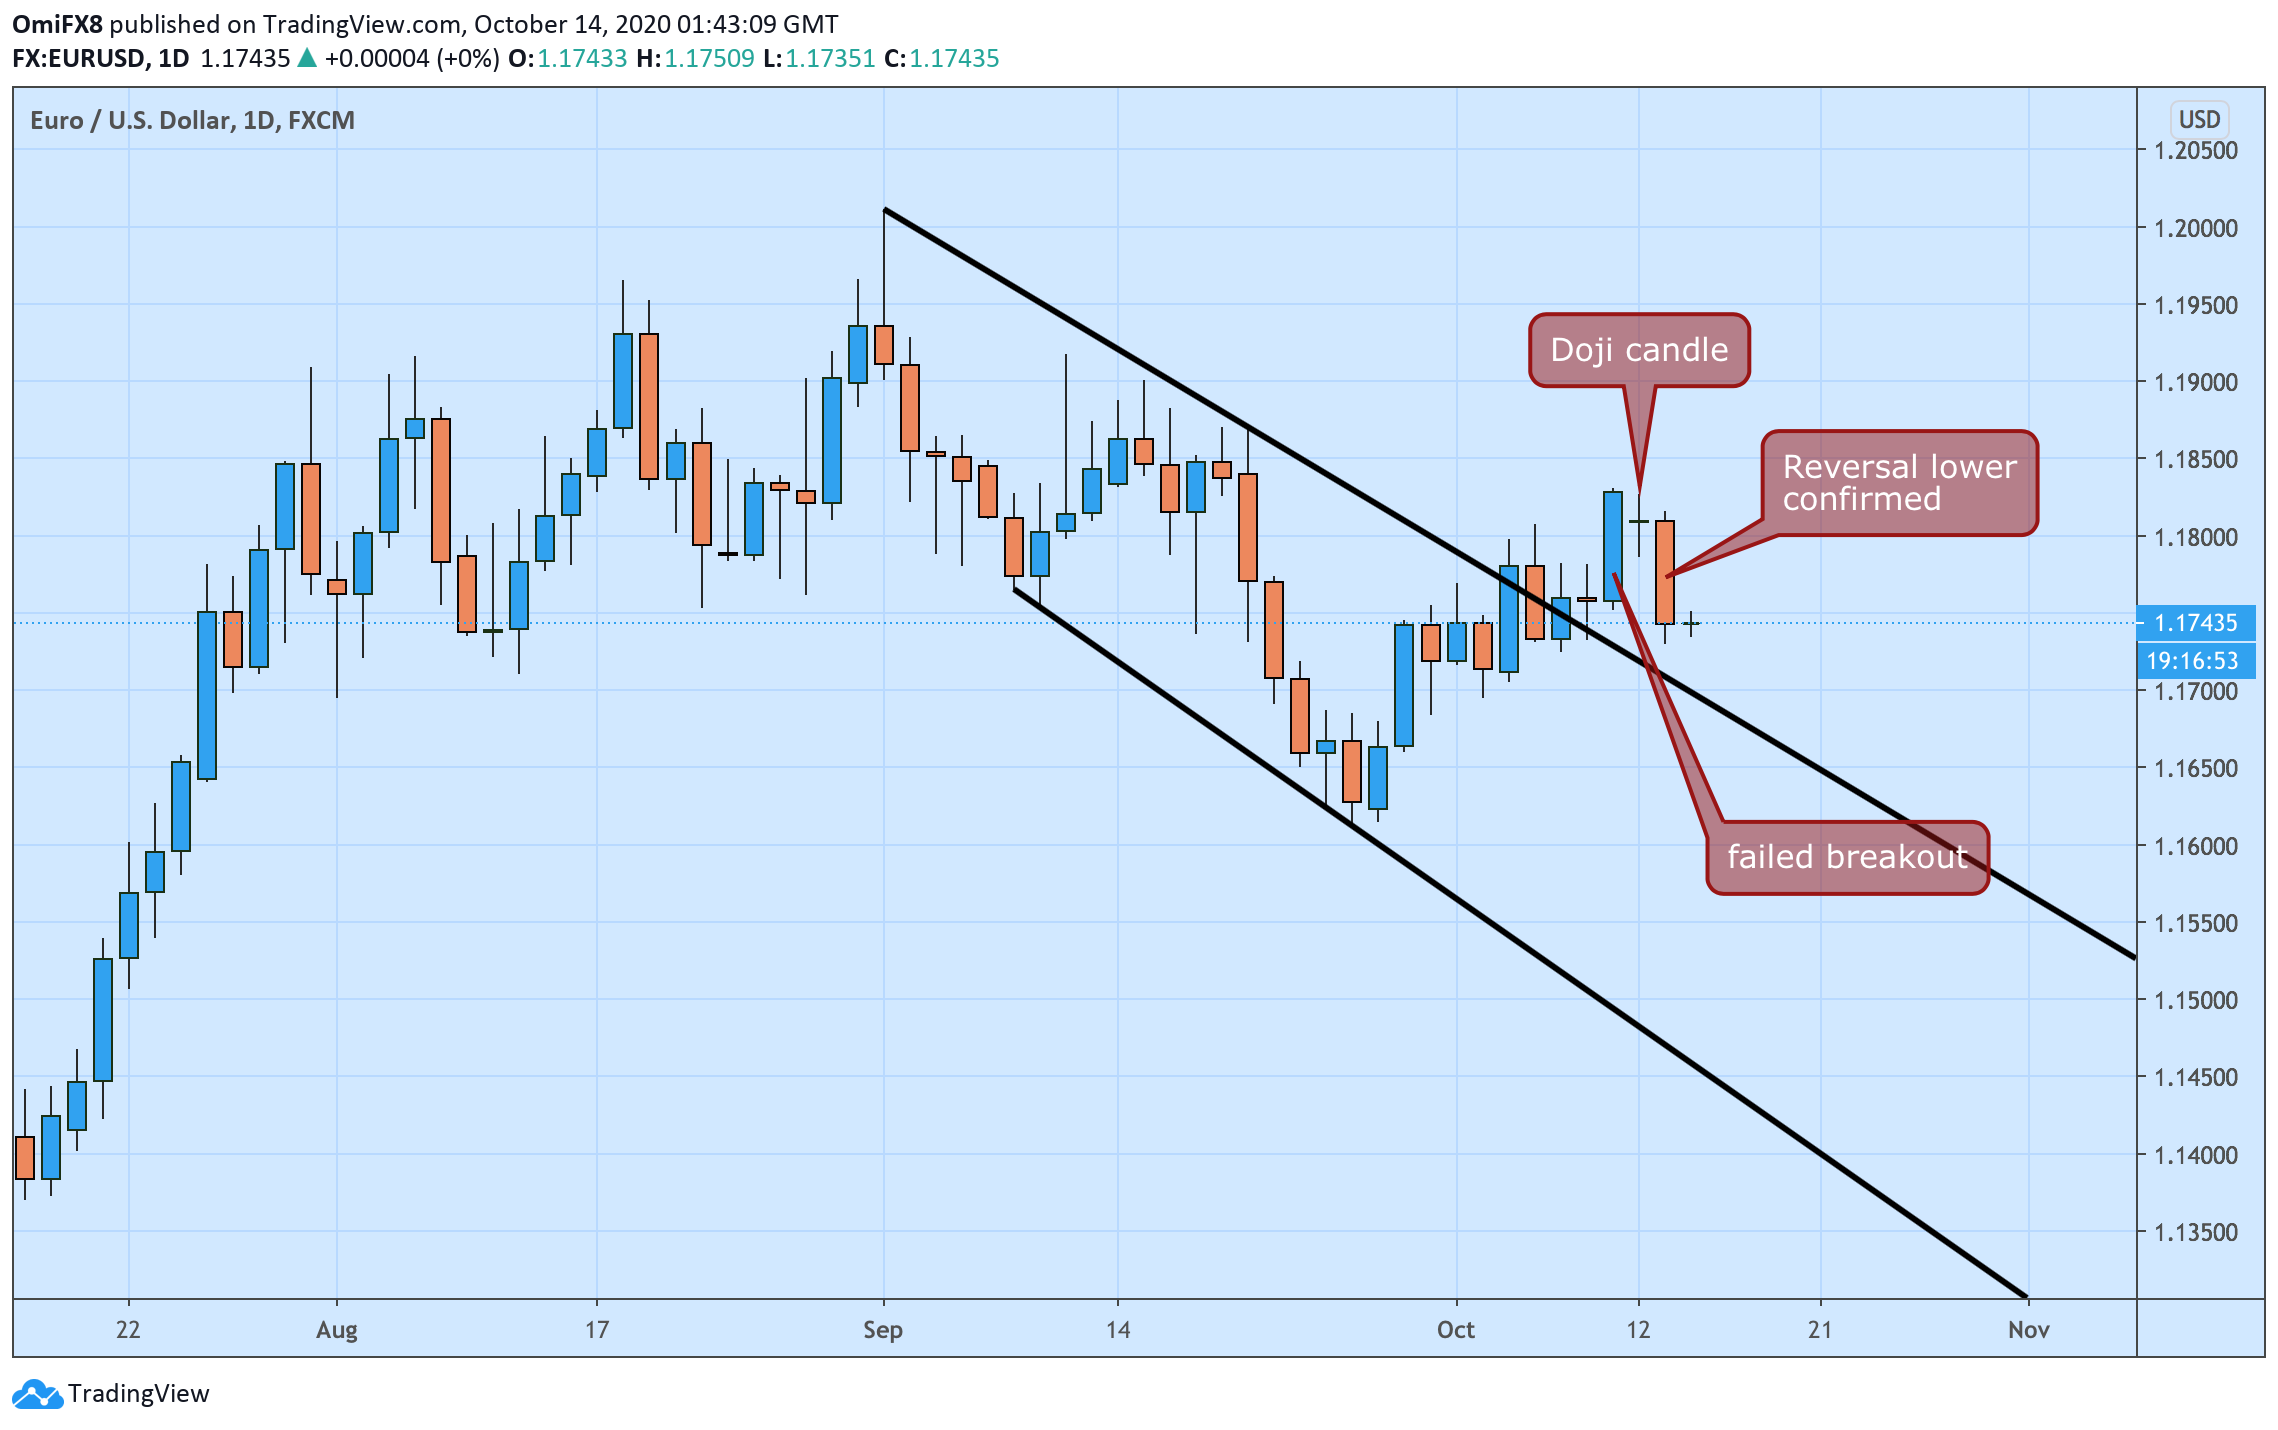
- EUR/USD's daily chart shows a bearish Doji reversal pattern.
- The pair risks falling to September lows near 1.1610.
EUR/USD looks south with the daily chart showing a bearish candlestick pattern and a failed breakout.
Tuesday's 0.57% drop indicates that the indecision period showed by Monday's Doji candle has ended with a bear victory. In other words, the pair has charted a bearish Doji reversal pattern in the past two days.
The reversal lower has invalidated a bearish channel breakout confirmed by Friday's bullish marubozu candle. A failed breakout often translates into stronger chart-driven selling.
As such, EUR/USD could soon revisit the Sept. 25 low of 1.1612. At press time, the pair is sidelined near 1.1742. A close above Friday's high of 1.1831 would revive the bullish outlook.
Daily chart

Trend: Bearish
Technical levels
