US Dollar Index Price Analysis: 100-SMA, monthly support defend DXY bulls
- DXY pares intraday losses, keeps bounces off 92.55 support confluence.
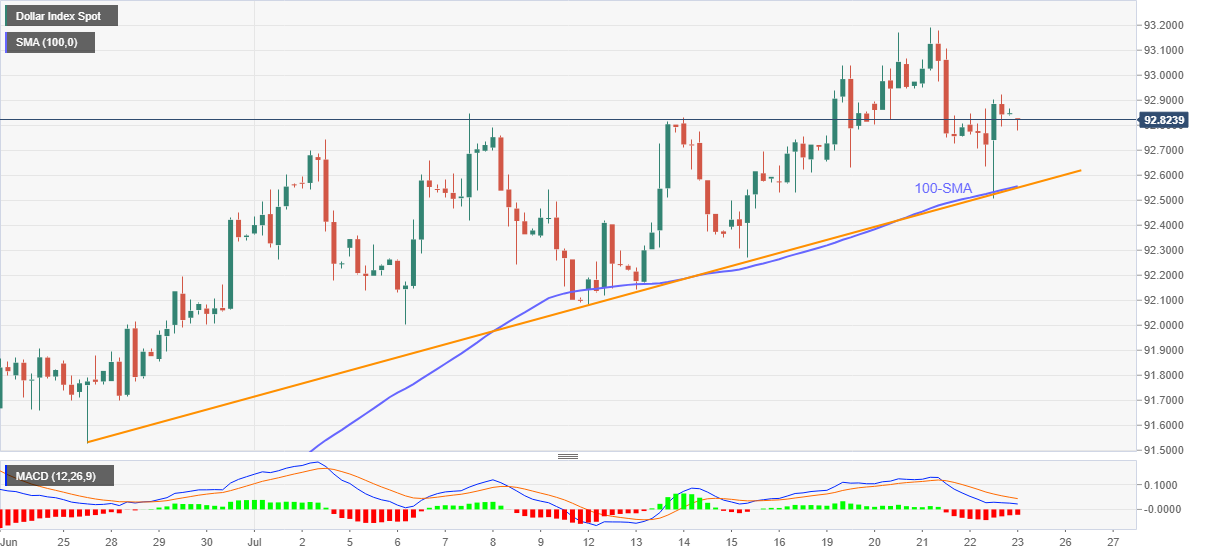
- MACD eases bearish bias but bulls are reluctant around multi-day tops.
US Dollar Index (DXY) picks up bids to 92.83 amid early Friday. In doing so, the greenback gauge keeps the previous day’s bounce off a convergence of 100-SMA and a one-month-old support line. However, the bulls are less active while waiting for the preliminary readings of July PMI.
Considering the gradually easing bearish bars of the MACD histograms, the DXY upside momentum seems to tighten towards the monthly high, also the highest since April, near 93.20.
However, any further won’t hesitate to refresh the yearly high by crossing the latest one near 93.45, aiming the August 2020 peak close to the 94.00 threshold.
On the contrary, a clear downside break of 92.55 will be important for the US Dollar Index to recall the short-term bears targeting the 92.00 round figure.
In a case where DXY bears dominate past 92.00, late June’s swing low near 91.50 should return to the chart.
Overall, the gauge grinds higher until staying beyond 92.55.
DXY: Four-hour chart
Trend: Bullish