US Dollar Index Price Analysis: Bulls step back from 200-HMA above 96.00
- DXY prints four-day uptrend, eases from intraday high.
- Firmer RSI favors bulls, weekly resistance line adds to the upside filters.
- Sellers await break of the immediate rising trend line.
US Dollar Index (DXY) pares intraday gains, the fourth in a row, around 96.25 during early Monday. In doing so, the greenback gauge battles 200-HMA to extend the previous week’s rebound.
Considering the firmer RSI line, not overbought, coupled with the sustained move beyond a one-week-old ascending support line, the US Dollar Index is likely to overcome the immediate hurdle around 96.30.
However, a descending trend line from November 24, near 96.40, challenges the DXY bulls.
Should the quote rises past 96.40, the November-end high around 96.65 will precede the previous month’s peak, also the highest level since mid-2020, close to the 97.00 threshold to challenge the greenback bulls.
Meanwhile, pullback moves remain elusive until staying beyond the nearby support line, around 96.00 at the latest.
In a case where the DXY bears remain dominant past 96.00, the latest swing low near 95.55 and the September 2020 peak of 94.75 will be in focus.
DXY: Hourly chart
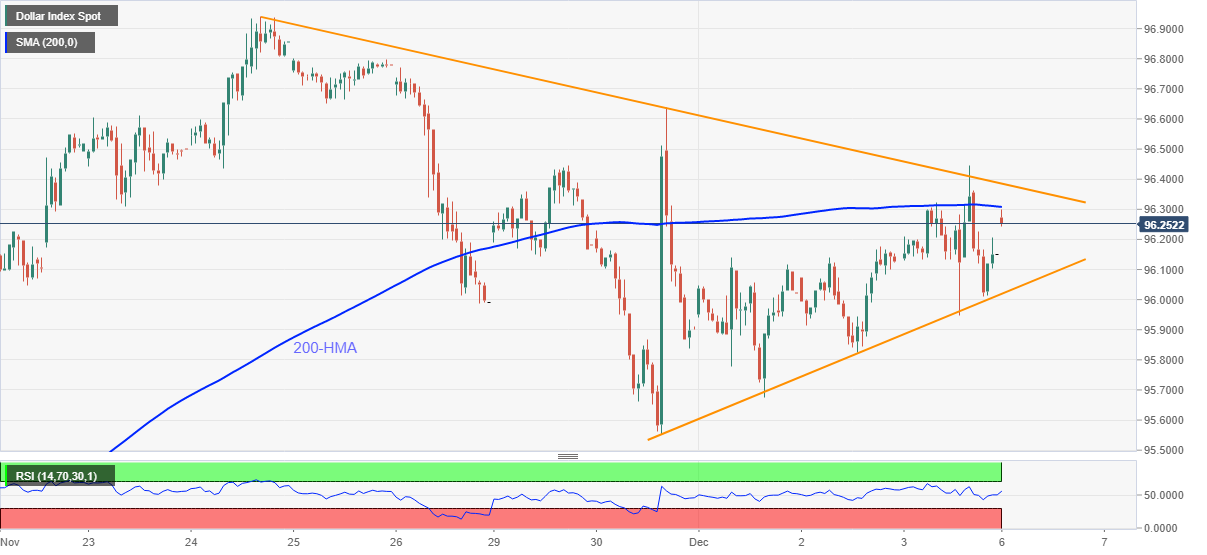
Trend: Bullish